Archive for the ‘PostGIS’ Category
Map algebra with callbacks in PostGIS 2.1
I’ve been playing with the much-enhanced raster support in PostGIS 2.1 in the last few days. Amongst other things I’ve been producing maps with ST_MapAlgebra, which has changed a little since 2.0.
The example callback function in the documentation is somewhat unhelpfully bare-bones: it always returns 0, touching none of its arguments. So here’s an equally useless — but rather more informative — example of a callback function for the simple one-raster, one-band, one-pixel-at-a-time case:
create or replace function
callback_fn(pixel float[], pos integer[], variadic userargs text[])
  returns float
  language plpgsql
  immutable  -- careful: this function is immutable, yours may not be
as $$
  declare
    pixval float;
    inputx integer;
    inputy integer;
  begin
    pixval := pixel[1][1][1];  -- pixel indices: [raster #][xdistance][ydistance]
    inputx := pos[1][1];       -- pos indices:   [raster #][x = 1, y = 2]
    inputy := pos[1][2];       --                (raster #0 is the output raster)

    return pixval + inputx + inputy;
  end;
$$;

-- example call:

select st_mapalgebra(rast, 1, 'callback_fn(float[], integer[], text[])'::regprocedure)
from raster_table;
And here’s something that caught me out: unless you’re passing some userargs, don’t declare your callback function to be strict. If you do, your callback function will never be called because its userargs argument is always null.
Sunrise and sunset times with PostGIS and PL/R
Since light can affect happiness, two important pieces of environmental data I add to the Mappiness data set during analysis are: (1) whether a response was made in daylight; and (2) day length when and where the response was made.
To derive these, I need the date, time and location of the response, and sunrise and sunset times for that date and location. R’s StreamMetabolism library provides sunrise/sunset calculations based on NOAA routines. And since my data is in PostGIS, it’s handy to use PL/R to access these.
I set this up as follows on my Ubuntu 12.04 GIS box.
In bash:
sudo aptitude install postgresql-9.1-plr sudo R |
In R:
install.packages('StreamMetabolism', dependencies = TRUE) |
In Postgres (9.1):
create extension plr; create table plr_modules (modseq int4, modsrc text); insert into plr_modules values (0, 'library("StreamMetabolism")'); create or replace function _r_daylight_period(lat double precision, lon double precision, datestring text, timezone text) returns setof integer as $$ return(as.integer(sunrise.set(lat, lon, datestring, timezone))) $$ language plr immutable strict; create or replace function sunrise(location geometry, moment timestamp without time zone, timezone text) returns timestamp without time zone as $$ select to_timestamp(min(s)) at time zone $3 from _r_daylight_period( st_y(st_transform($1, 4326)), -- 4326 = WGS84 st_x(st_transform($1, 4326)), to_char($2, 'YYYY/MM/DD'), $3 ) s $$ language sql immutable strict; create or replace function sunset(location geometry, moment timestamp without time zone, timezone text) returns timestamp without time zone as $$ select to_timestamp(max(s)) at time zone $3 from _r_daylight_period( st_y(st_transform($1, 4326)), -- 4326 = WGS84 st_x(st_transform($1, 4326)), to_char($2, 'YYYY/MM/DD'), $3 ) s $$ language sql immutable strict; create or replace function is_daylight(location geometry, moment timestamp without time zone, timezone text) returns boolean as $$ select (sunrise($1, $2, $3), sunset($1, $2, $3)) overlaps ($2, cast('0' as interval)); $$ language sql immutable strict; create or replace function hours_in_the_day(location geometry, moment timestamp without time zone, timezone text) returns double precision as $$ select extract(epoch from sunset($1, $2, $3) - sunrise($1, $2, $3)) / 3600.0; $$ language sql immutable strict; |
These new functions can be used like so:
select is_daylight(geom, moment, 'Europe/London'), hours_in_the_day(geom, moment, 'Europe/London') from mytable; |
(Note: what I actually do with the Mappiness data is to use a single call to _r_daylight_period, and calculate the other quantities as a second step. This speeds things up a lot, because I have millions of rows to process and Postgres doesn’t appear to do as much caching of immutable function results as one would like here).
Using the OSTN02 transformation in PostGIS
When converting coordinates between WGS84 (GPS) and OSGB36 (UK National Grid), using OSTN02 can gain us a few metres in accuracy over the basic parametric transformation provided by PostGIS’s st_transform via PROJ.4.
Happily, Ordnance Survey now distribute an NTv2 version of the OSTN02 transformation, courtesy of the Defence Geographic Centre, which can be used by PROJ.4 and, therefore, PostGIS.
How to compile PostGIS 2.1 on Ubuntu Server 12.04+
PostGIS 2 has some exciting new goodies — including raster support — that I’m keen to use in the analysis of Mappiness data.
But the PostGIS package provided by Ubuntu 12.04 is still only at version 1.5, and the GEOS and GDAL packages are also too old to support the new version.
So — this is how I compiled PostGIS 2.0.1 2.0.3 2.1.0rc2 2.1.0 and its dependencies on my GIS server.
Polygons from PostGIS to Processing
There are plenty of ways to get spatial data from a PostGIS database into a Processing sketch.
You can export to CSV or SVG and load it from there; you can query the database directly; or, depending on context, you might choose to generate Processing commands directly, which is the route I went to display a background map of the UK in a recent visualization project.
Approximating kernel-weighted proportions in PostGIS
Imagine you want compare various locations in terms of the availability of a certain type of environment, such as fresh water.
You might want to use a measure of the proximity of that environment — such as the nearest neighbour distance.
You might want to use a measure of the quantity of that environment in the vicinity — such as the proportion of land within a specific radius that is of that type.
Or you might ideally like a measure that combines both of these: one that incorporates the quantity of that environment, but gives greater weight to areas that are nearer, and lesser weight to those that are further away.
In that third case, what you probably want is a kernel-weighted proportion.
Simple PostGIS nearest neighbour function
Here’s a less generic and slightly different nearest-neighbour function based on Regina’s generic nearest-neighbour function at Boston GIS.
It follows the same basic idea of using series of enlarging search radii to restrict distance calculations to a manageable subset of things-that-might-be-near. The difference is that it uses a geometric progression of sizes (x, x * y, x * y^2, x * y^3, ...) instead of an arithmetic one (x, x + y, x + 2y, x + 3y, ...).
For some distributions of things-that-might-be-near, and tuned with the right parameters (x, y), this turns out substantially faster (I’ve used it to locate the nearest UK postcode to each mappiness response).
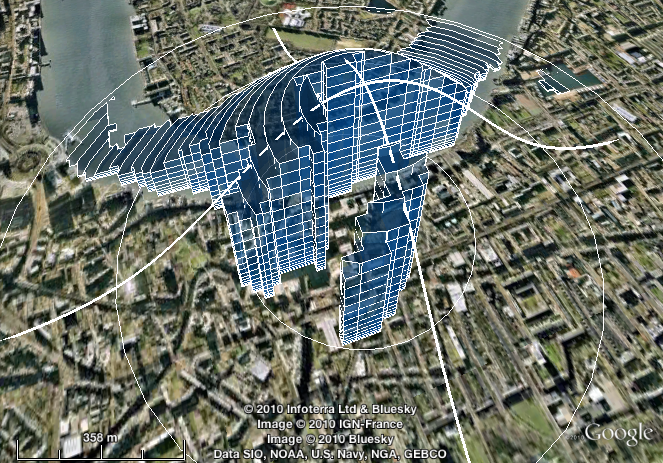
as_kmldoc: easily visualise PostGIS queries as KML in Google Earth
PostGIS has an st_askml function. This turns geometries into fragments of KML, and thus takes you most of the way to easy visualisation of spatial queries using Google Earth. But not all the way: these fragments have then to be assembled into a complete document.
I’ve written some wrapper and aggregate functions to automate this. They’re probably deeply inefficient — I wouldn’t advocate building your next web service on them — but for one-off eyeballing of query results I find them really useful.
The key functions are called as_kmldoc; you could see them as the missing aggregate versions of st_askml.
Using OS Code-Point Polygons in PostGIS
Ordnance Survey’s Code-Point with Polygons “provides a precise geographical location for each postcode unit in Great Britain”. It’s available in various formats, including ESRI .shp files.
Many UK academics can access the data via institutional subscription to EDINA Digimap. I’m using it in my research into subjective wellbeing and environmental quality.
This post shows how to:
- import the data files into a PostGIS database; and
- de-normalise the data into a single table, where there’s a one-to-one mapping of postcodes to rows, and each row contains either all geographical locations covered by a postcode (as a single geometry column, of type multipolygon) or the reason why no such location is available
Importing the National Statistics Postcode Directory into PostGIS
This isn’t a very difficult task, but creating the table is somewhat laborious, so perhaps you’ll find the following SQL helpful.